Tutorial
After installing pyeemd as described in Installing pyeemd you are all set to using it with:
import pyeemd
The three main decomposition routines implemented in pyeemd – EMD, EEMD and
CEEMDAN – are available as emd(), eemd() and
ceemdan(), respectively. All these methods use similar
conventions so interchanging one for another is easy.
Input data to these routines can be any kind of Python sequence that
numpy can convert to an 1D array of floating point values. The output
data will be a 2D numpy array, where each row of the array represents a
single intrinsic mode function (IMF).
As an example, the examples subfolder of pyeemd contains a file
ecg.csv, which contains ECG (electrocardiogram) data from the MIT-BIH
Normal Sinus Rhythm Database. The
data is in CSV (comma separated value) format, which can be read into Python in
many ways, one of which is using numpy.loadtxt() using the appropriate
delimiter:
from numpy import loadtxt

ecg = loadtxt("ecg.csv", delimiter=',')
Now we have the data in a numpy array ecg. We can quickly plot what
the data looks like using matplotlib.pyplot.
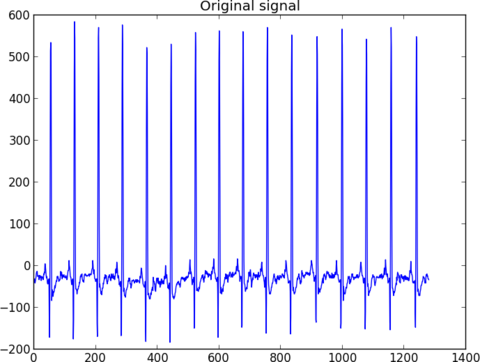
Original ECG signal as plotted by matplotlib.pyplot.
from matplotlib.pyplot import plot, show, title

title("Original signal")
plot(ecg)
show()
The data stored in ecg can be decomposed with CEEMDAN using the routine
ceemdan(). The only thing we need to decide is what to use as the
stopping criterion for the sifting iterations. In this example we use a
S-number of 4 and a maximum number of siftings of 50:
from pyeemd import ceemdan

imfs = ceemdan(ecg, S_number=4, num_siftings=50)
Now the rows of the 2D array imfs are the IMFs the original signal decomposes
to when applying CEEMDAN. We can plot these IMFs using matplotlib.pyplot
as before, but pyeemd also comes with an utility function
plot_imfs() for easily plotting the IMFs (using
matplotlib.pyplot) in separate figures.
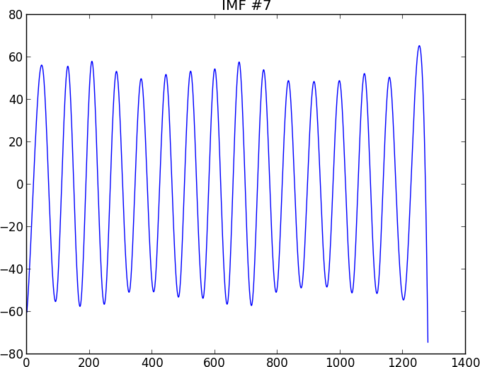
IMF 7 extracted from ECG data with ceemdan() and plotted with
plot_imfs().
from pyeemd.utils import plot_imfs

plot_imfs(imfs, plot_splines=False)
show()
The plot_splines=False argument prevents the plotting of the envelope
curves of the IMFs, which would otherwise be shown.
This concludes our simple tutorial. For more in-depth information about the
methods available in pyeemd please head to the API documentation. You can also
look at example code at the examples subdirectory of pyeemd. How you
choose to use or process the IMFs obtained by the decomposition routines is
beyond the scope of this document – and beyond the scope of pyeemd – but you
might be interested in the Hilbert transform routine offered by
scipy.fftpack.hilbert().